Real-world challenges such as small sample sizes, skewed distributions of data, biased sampling designs, and more predictors than data points are pushing the limits of classical statistical analysis. This textbook provides a new tool for the statistical toolkit: data simulations. It shows that using simulation and data-generating models is an excellent way to validate statistical reasoning and to augment study design and statistical analysis with planning and visualization. Although data simulations are not new to professional statisticians, Statistics by Simulation makes the approach accessible to a broader audience, with examples from many fields. It introduces the reasoning behind data simulation and then shows how to apply it in planning experiments or observational studies, developing analytical workflows, deploying model diagnostics, and developing new indices and statistical methods.
• Covers all steps of statistical practice, from planning projects to post-hoc analysis and model checking
• Provides examples from disciplines including sociology, psychology, ecology, economics, physics, and medicine
• Includes R code for all examples, with data and code freely available online
• Offers bullet-point outlines and summaries of each chapter
• Minimizes the use of jargon and requires only basic statistical background and skills
Carsten F. Dormann is professor of biometry and environmental system analysis at the University of Freiburg, Germany. He is the author of the introductory textbook Environmental Data Analysis and coauthor of an open marine ecology textbook, Marine Ecology Notes. Aaron M. Ellison served for twenty years as the senior research fellow in ecology at Harvard University. He is the author of A Field Guide to the Ants of New England and Vanishing Point and coauthor of A Primer of Ecological Statistics, Scaling in Ecology with a Model System, and other books.
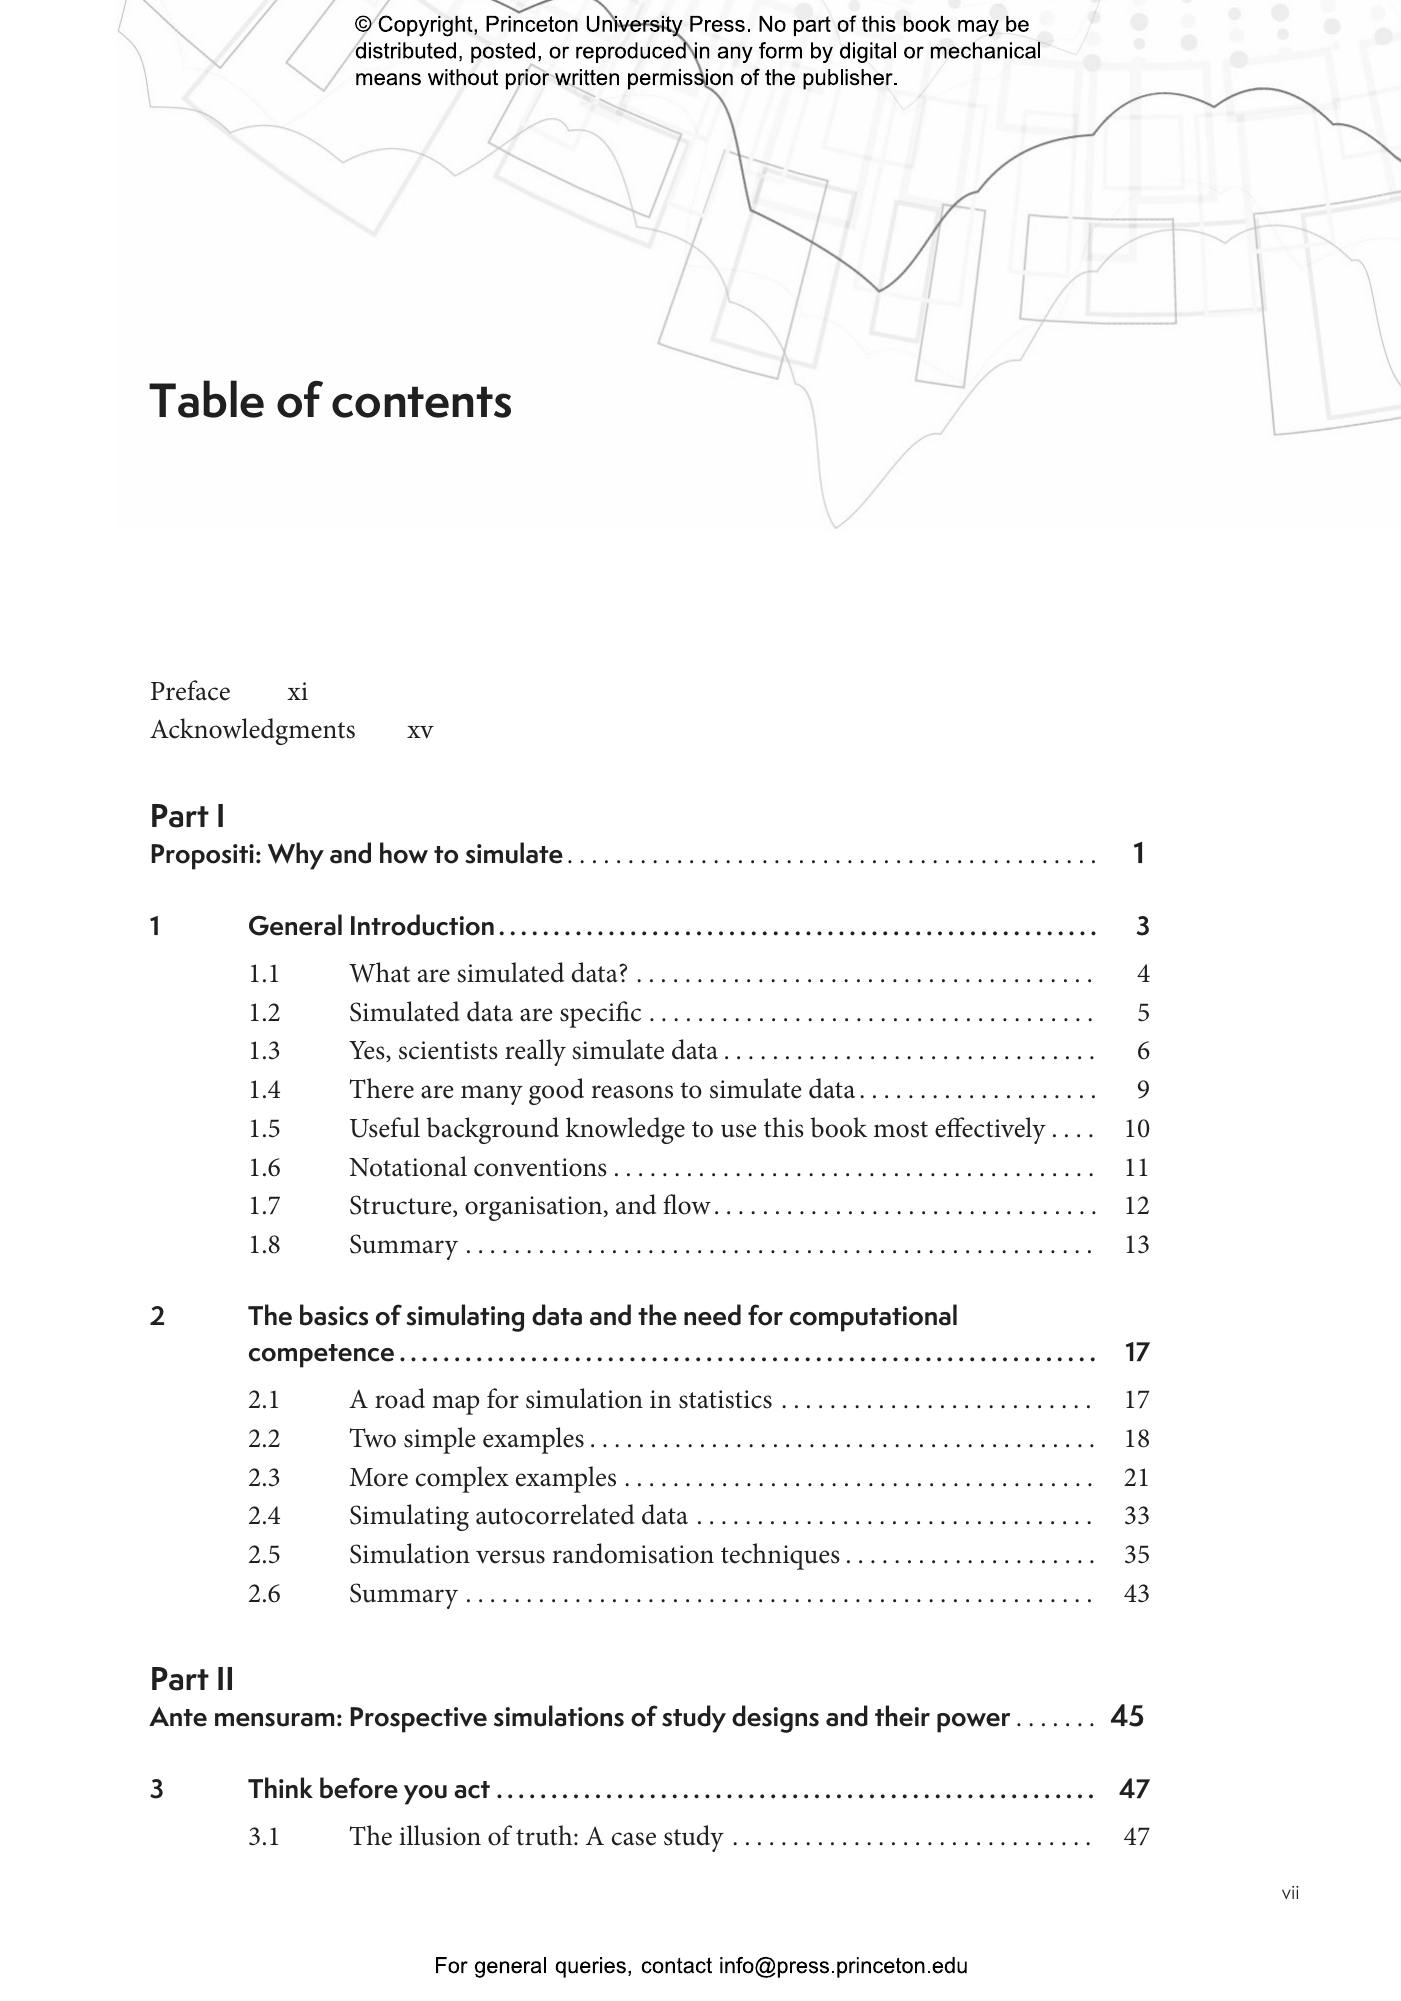
- Part I: Propositi: Why and how to simulate
- 1. General Introduction
- 1.1 What are simulated data?
- 1.2 Simulated data are specific
- 1.3 Yes, scientists really simulate data
- 1.4 There are many good reasons to simulate data
- 1.5 Useful background knowledge to use this book most effectively
- 1.6 Notational conventions
- 1.7 Structure, organisation, and flow
- 1.8 Summary
- 2. The basics of simulating data and the need for computational competence
- 2.1 A road map for simulation in statistics
- 2.2 Two simple examples
- 2.3 More complex examples
- 2.4 Simulating autocorrelated data
- 2.5 Simulation versus randomisation techniques
- 2.6 Summary
- Part II: Ante mensuram: Prospective simulations of study designs and their power
- 3. Think before you act
- 3.1 The illusion of truth: A case study
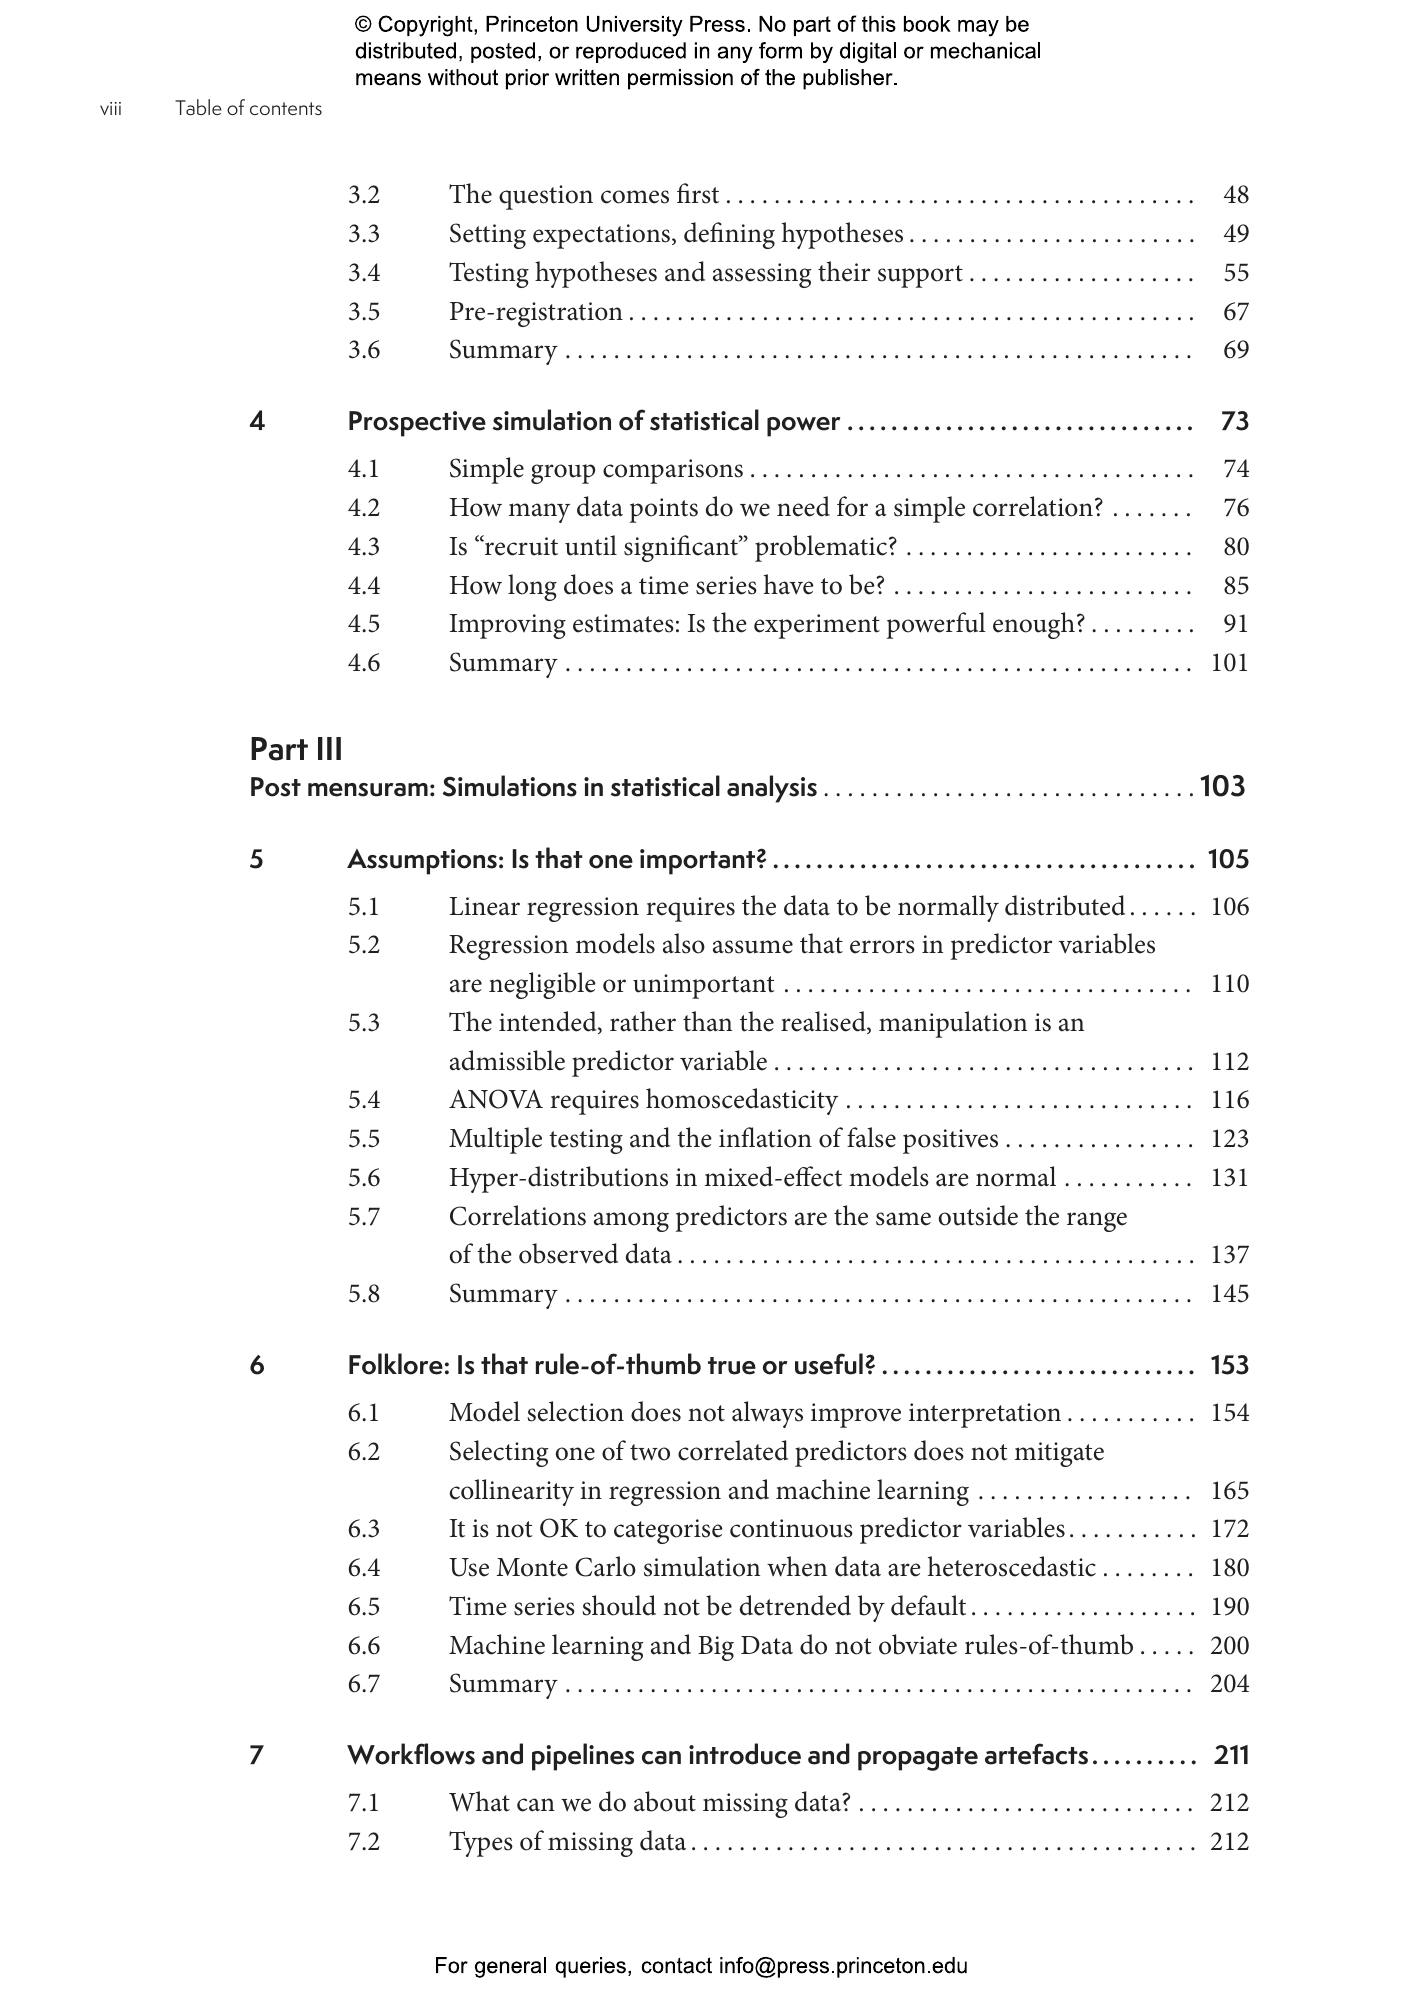
- 3.2 The question comes first
- 3.3 Setting expectations, defining hypotheses
- 3.4 Testing hypotheses and assessing their support
- 3.5 Pre-registration
- 3.6 Summary
- 4. Prospective simulation of statistical power
- 4.1 Simple group comparisons
- 4.2 How many data points do we need for a simple correlation?
- 4.3 Is “recruit until significant” problematic?
- 4.4 How long does a time series have to be?
- 4.5 Improving estimates: Is the experiment powerful enough?
- 4.6 Summary
- Part III: Post mensuram: Simulations in statistical analysis
- 5. Assumptions: Is that one important?
- 5.1 Linear regression requires the data to be normally distributed
- 5.2 Regression models also assume that errors in predictor variables are negligible or unimportant
- 5.3 The intended, rather than the realised, manipulation is an admissible predictor variable
- 5.4 ANOVA requires homoscedasticity
- 5.5 Multiple testing and the inflation of false positives
- 5.6 Hyper-distributions in mixed-effect models are normal
- 5.7 Correlations among predictors are the same outside the range of the observed data
- 5.8 Summary
- 6. Folklore: Is that rule-of-thumb true or useful?
- 6.1 Model selection does not always improve interpretation
- 6.2 Selecting one of two correlated predictors does not mitigate collinearity in regression and machine learning
- 6.3 It is not OK to categorise continuous predictor variables
- 6.4 Use Monte Carlo simulation when data are heteroscedastic
- 6.5 Time series should not be detrended by default
- 6.6 Machine learning and Big Data do not obviate rules-of-thumb
- 6.7 Summary
- 7. Workflows and pipelines can introduce and propagate artefacts
- 7.1 What can we do about missing data?
- 7.2 Types of missing data
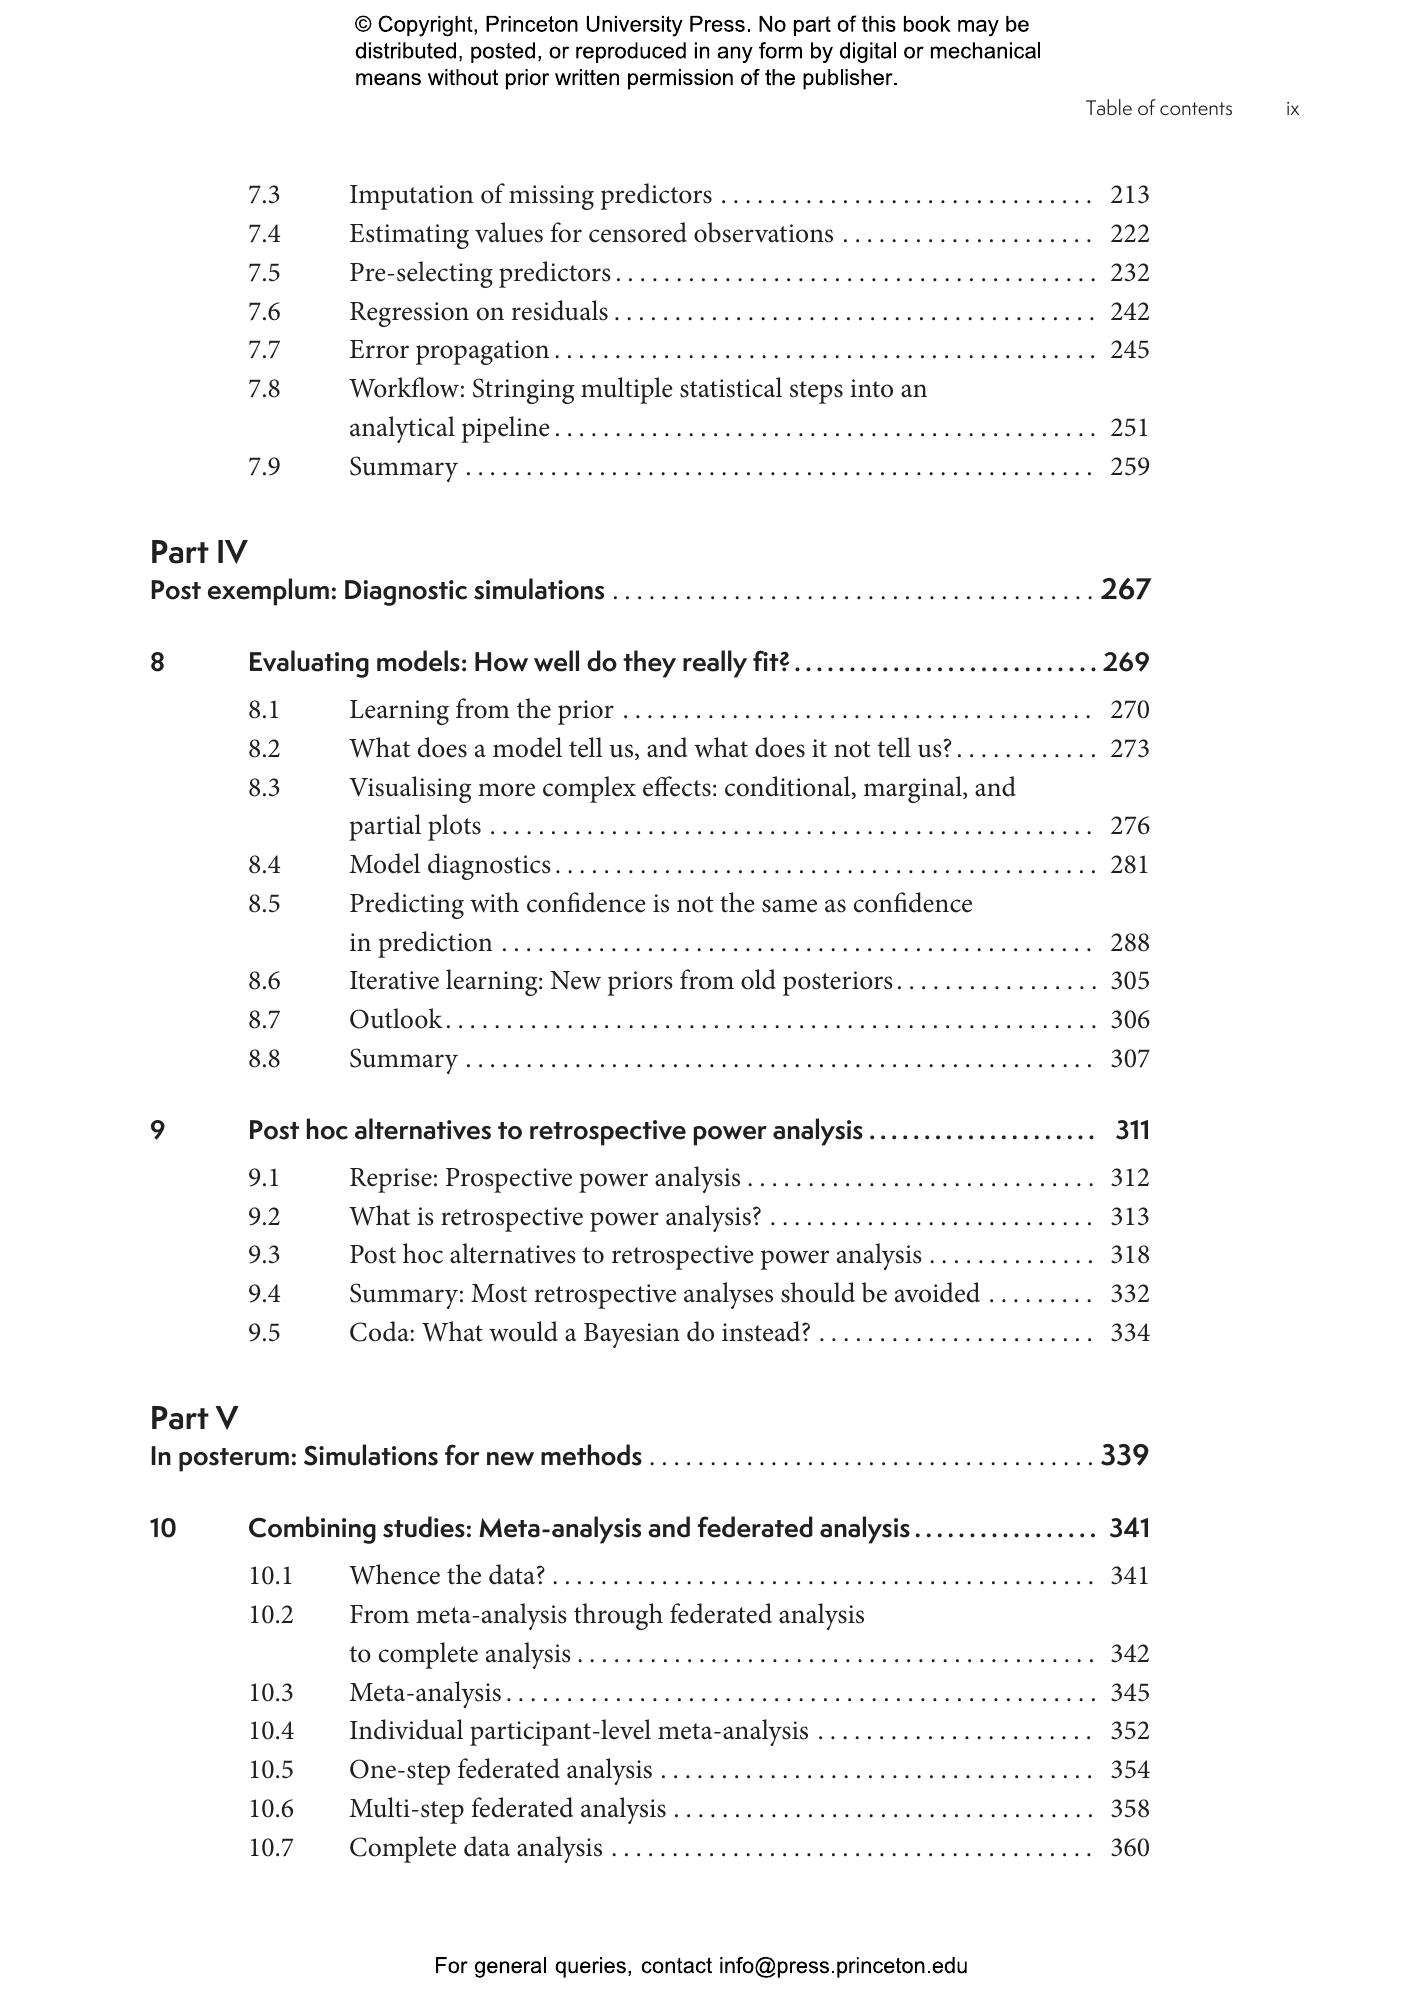
- 7.3 Imputation of missing predictors
- 7.4 Estimating values for censored observations
- 7.5 Pre-selecting predictors
- 7.6 Regression on residuals
- 7.7 Error propagation
- 7.8 Workflow: Stringing multiple statistical steps into an analytical pipeline
- 7.9 Summary
- Part IV: Post exemplum: Diagnostic simulations
- 8. Evaluating models: How well do they really fit?
- 8.1 Learning from the prior
- 8.2 What does a model tell us, and what does it not tell us?
- 8.3 Visualising more complex effects: conditional, marginal, and partial plots
- 8.4 Model diagnostics
- 8.5 Predicting with confidence is not the same as confidence in prediction
- 8.6 Iterative learning: New priors from old posteriors
- 8.7 Outlook
- 8.8 Summary
- 9. Post hoc alternatives to retrospective power analysis
- 9.1 Reprise: Prospective power analysis
- 9.2 What is retrospective power analysis?
- 9.3 Post hoc alternatives to retrospective power analysis
- 9.4 Summary: Most retrospective analyses should be avoided
- 9.5 Coda: What would a Bayesian do instead?
- Part V: In posterum: Simulations for new methods
- 10. Combining studies: Meta-analysis and federated analysis
- 10.1 Whence the data?
- 10.2 From meta-analysis through federated analysis to complete analysis
- 10.3 Meta-analysis
- 10.4 Individual participant-level meta-analysis
- 10.5 One-step federated analysis
- 10.6 Multi-step federated analysis
- 10.7 Complete data analysis
- 10.8 Conclusions and outlook
- 10.9 Summary
- 11. Putting it through its paces: Does this new method work?
- 11.1 Unit testing
- 11.2 Dimensional analysis
- 11.3 Comparisons
- 11.4 Intellectual advancement
- 11.5 Intuitive understanding
- 11.6 Model-agnostic number of parameters: Generalised degrees of freedom
- 11.7 Know your limits
- 11.8 Summary
- 12. Outroduction: How far should we push simulations?
- 12.1 Stochastic weather forecasting
- 12.2 Infusing fake signals to test the workflow at LIGO
- 12.3 Virtual LIDAR scanning
- 12.4 Advanced simulation may be neither possible nor desirable
- A: Useful R functions for data simulations
- A.1 Drawing random values from a distribution
- A.2 Doing things repeatedly: for-loops and replicate
- A.3 Shuffling, resampling, and bootstrapping: sample()
- A.4 Little helpers
- A.5 Dedicated simulation packages
“This will be a very useful book—an excellent and thought-provoking resource. I’m likely to be one of the first in line to buy a copy.”—Evan Cooch, Cornell University
“This book demonstrates for all aspects of the research process that simulations are useful. It uses engaging and thought-provoking real-world examples to show how powerful simulations can be. It is obvious that the authors are deep thinkers and are at the forefront of modern statistical practices.”—Joshua Jackson, Washington University in St. Louis